
Надежность
20 лет на рынке наружной рекламы, более 10 000 проектов.

Наличие
Более 300 собственных рекламных локаций.

Стиль работы
Оперативность, контроль на всех этапах работы. Грамотные, мотивирующие эскизы. Монтажи практически в любое время.

Результат
Увеличение Ваших потенциальных клиентов в разы.
о нас
Мы не просто размещаем информацию о Ваших товарах и услугах на конструкциях с самым большим количеством контактов в единицу времени. Мы создаем эскизы которые мотивируют – купить. Мы улавливаем именно Вашу целевую аудиторию.
Репако+ одна из немногих на рынке компаний кто реально занимается маркетинговыми исследованиями и реально отвечает на потребность клиента.
наши клиенты


Ким Светлана Михайловна
Генеральный директор ТОО "Optium Media Solutions"
Общество с ограниченной ответственностью " Optimum Media Solutions ", в лице генерального директора Ким Светланы Михайловны, выражает благодарность коллективу "ТОО Реако+" за успешноесотрудничество, своевременность, оперативность, ответственность при выполнении поручений.
Боровик Артем Евгеньевич
Директор магазина "KOTON"
От имени магазина "КОТОН" благодарю коллектив "ТОО Репако+" за взаимовыгодное сотрудничество и добропорядочные партнерские отношения, проявленные при рекламной компании магазина Котон. Надеюсь и в будущем на Вашу надежность и высокую репутацию.
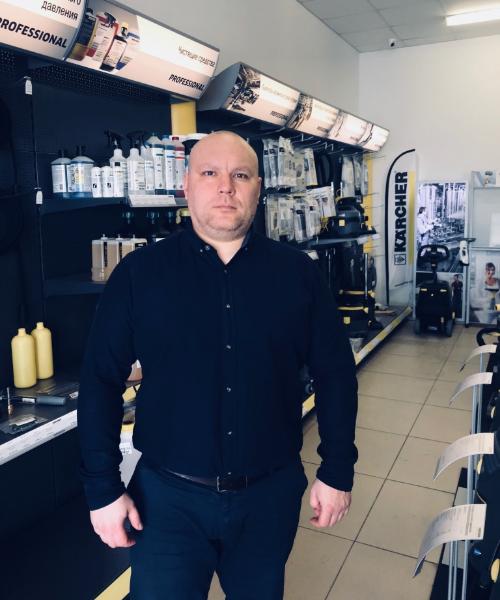
Едигенов Р.М.
Директор филиала ТОО "Керхер"
От лица компании " Керхер " и от себя лично выражаю Вам и всем сотрудникам компании "ТОО Репако+" благодарность за продуктивную и качественную работу, чуткое отношение к требованиям клиента и технически грамотное решение наших рекламных задач.
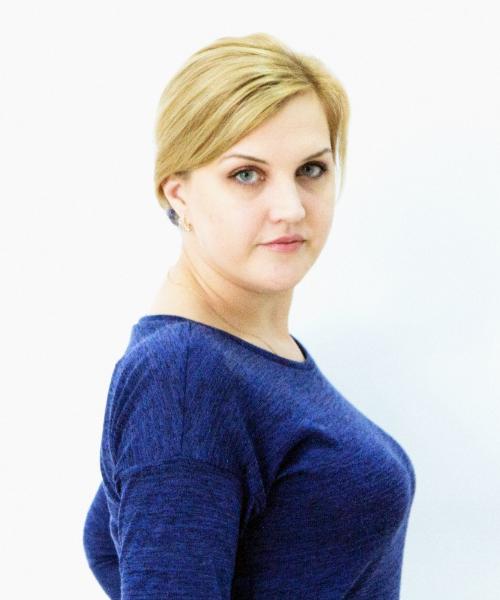
Москалева Юлия
Маркетолог ТОО "БК-Маркет"
От лица нашей компании хотелось бы поблагодарить коллектив ТОО "Репако+" за уже проделанную профессиональную работу и еще предстоящую, в безукоризненности которой не приходится сомневаться.
Также благодарим за отзывчивость и понимание, коими Вы щедро сопровождаете наше с Вами сотрудничество.
Мы рады, что Вы содействуете развитию нашего бизнеса, эффективно обеспечивая комфортную работу с рекламой нашей организации.
Наши Проекты
Клиентоориентированный подход, который мы ввели 6 лет назад, дает нашим клиентам качество, оперативность, комфорт и увереность в работе с нами.